Insights from the CDH Benchmark Survey: Measuring Product and Team Performance
For years, I’ve shared that Product Talk’s outcome is to increase the number of teams who adopt the continuous discovery habits that I outlined in my book.
The challenge with this outcome is that it’s hard to measure. It’s directionally correct, but without a clear sense of where we are today, it’s hard to assess if we are making progress.
I can use proxies. I can count how many people enroll in our courses, engage us for coaching, or join our community. I can measure the efficacy of each of those programs and how they impact people’s behaviors. And we do all of that.
But I can’t say X out of Y teams have adopted the continuous discovery habits. And when someone on Twitter argues that no teams actually work this way, I can share anecdotal data, but I can’t share hard numbers.
I want to change that. So last fall, we ran the inaugural CDH Benchmark survey. We asked roughly 2,000 people to tell us about their discovery habits.
Who Did We Talk to?
We had 1,999 people complete the survey between September 21 and November 18, 2022. The survey respondents represented 78 countries, spanning 6 continents, with the most responses coming from the United States (565), the United Kingdom (174), Germany (165), Brazil (101), Canada (88), India (77), Spain (63), Australia (50), Sweden (37), and the Netherlands (37).
Overwhelmingly, the majority of our participants worked in a product management function (1,388), but we also had representation from design (181), user research (86), engineering (51), and smaller numbers representing coaches, product operations, design operations, scrum masters, program/project management, and a variety of other roles.
Participants represented companies of all sizes as indicated by the following breakdown:
- 1–10 employees (68)
- 11–50 employees (254)
- 51–200 employees (431)
- 202–1,000 employees (396)
- 1,001–10,000 employees (346)
- 10,000+ employees (298)
I promoted the survey on LinkedIn, Twitter, Facebook, and in the CDH Membership community. I also asked thought leaders in product, design, and engineering to help promote the survey. We raffled off CDH Memberships and Product Talk Academy course tickets as an incentive to complete the survey.
As with any survey, the response pool was influenced by where I recruited and how I incentivized responses. My personal social networks tend to skew more towards product management than design or engineering. And our courses and membership tend to appeal to product managers more than designers and engineers. However, I am hoping to change that. I do believe that discovery is a team sport and should be equally applicable to all of these roles. Next year, I will put a concerted effort into getting a better spread of roles represented.
Defining Success: How Successful Were the Respondents’ Products?
I had two primary goals when launching this survey. I wanted to understand:
- how many people were adopting each of the continuous discovery habits that I outlined in my book.
- if teams with better habits were more likely to have success than teams who haven’t developed their habits.
The first question is fairly easy to answer. We simply need to collect information about what people do when. The second question is much more complex. To answer this question, I had to first define what I meant by success.
In business, we tend to define success as profitable and growing. Profit is dependent upon increasing revenue and/or decreasing costs. Most products are designed to do one or the other. If you work on Netflix' subscription service, you are focused on growing revenue. If, on the other hand, you are working on internal software that helps the Netflix support team respond to support tickets more efficiently, your product contributes to decreasing costs.
One way we might measure success is to ask people if their product is designed to increase revenue or decrease costs and then ask if it did increase revenue or decrease costs in the prior quarter.
But that leaves out products that are pre-revenue or aren’t yet having an impact. So I also wanted to include some measures about adoption and usage.
And finally, I didn’t want to limit my definition of success to just the success of the product. I was also curious if the participant was satisfied with working with their team and at their company.
Understanding Financial Success: Is Your Product Having an Impact?
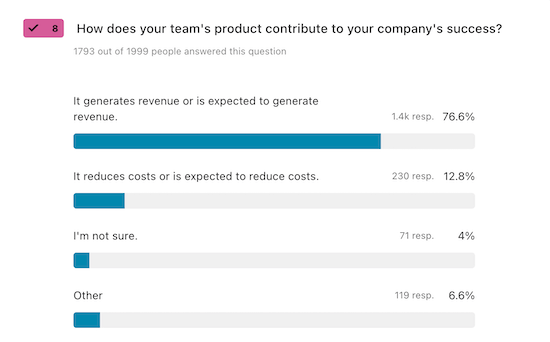
To measure success, I started by asking each participant, “How does your team’s product contribute to your company’s success?" Here’s how the responses broke down:
- It generates revenue or is expected to generate revenue. (1,373)
- It reduces costs or is expected to reduce costs. (230)
- I’m not sure. (71)
- Other (119)
Overwhelmingly, the majority of respondents indicated their product is expected to generate revenue. This was not surprising to me. It’s consistent with what I’ve seen across the teams that I work with directly. Most product teams are contributing to top-line revenue.
What did surprise me was the last two options. While 71 people is only 4% of the responses, most of the “Other” responses also indicated that the respondent really wasn’t sure. That means upwards of 10% of respondents didn’t know if their product was intended to generate revenue or if it was intended to help reduce costs. This exposes a gap in the way leaders are helping teams understand their strategic context and the role their work plays in the overall health of the business.
For folks who indicated their product was expected to generate revenue or decrease costs, we asked about performance.
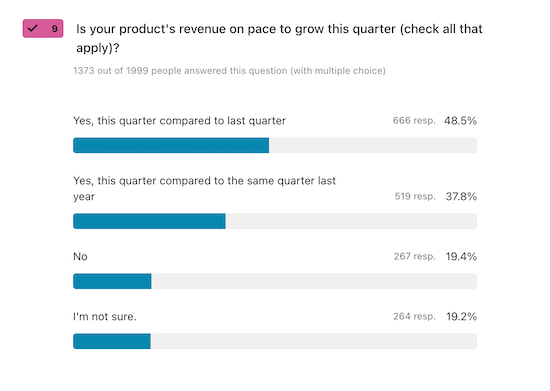
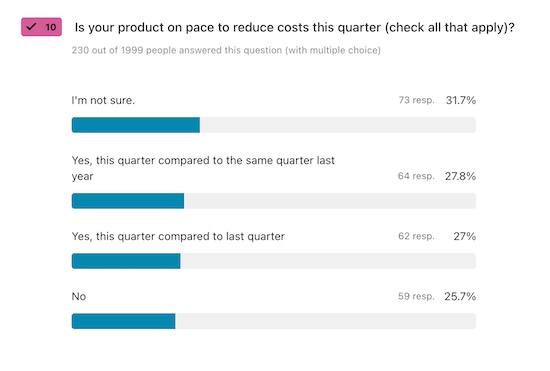
About 60% of respondents said their product was on pace to grow revenue. For the cost-saving folks, it wasn’t as optimistic. Fewer than 43% of respondents said their product was on pace to reduce costs.
I’m not surprised by these mixed results. Product is hard. Having a direct impact on financial metrics is hard. I think it’s important for people to see how often teams fall short of revenue or cost-savings goals. This is the norm.
I was surprised to see the large number of folks who weren’t sure if their product was on pace to grow revenue or reduce costs. It’s clear product leaders need to be doing more to help teams connect the dots between their teams’ activities and the health of the business.
Understanding Customer Growth and Adoption: Do Customers Want to Use Your Product?
For teams that might be pre-revenue or might be focused on milestone metrics on the way to revenue, we also asked about customer growth and adoption.
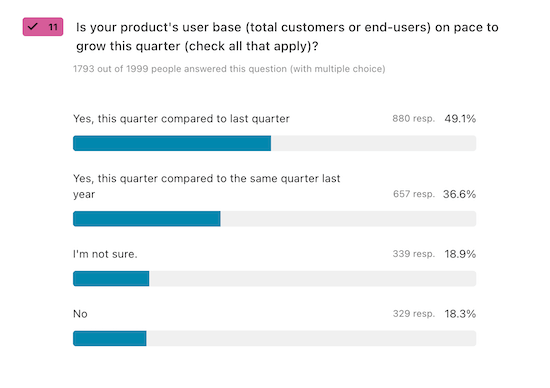
We asked customers, “Is your product’s user base (total customers or end-users) on pace to grow this quarter?” A whopping 62.8% of respondents said yes to this question, while 37.2% of respondents said no or they weren’t sure.
If we are talking about paying customers, this is a great question and a good indicator that you are positively impacting revenue. However, this question can also represent a vanity metric for companies who might just be counting free registrations.
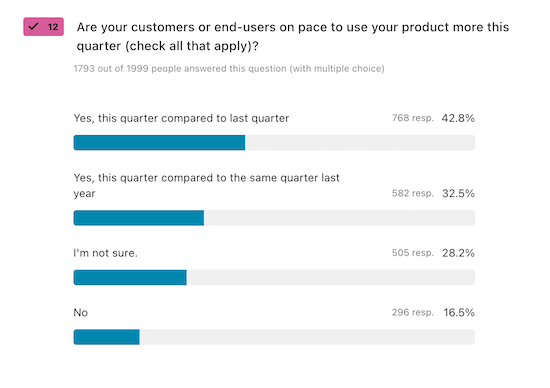
So we also asked, “Are your customers or end-users on pace to use your product more this quarter?” 55.3% of respondents said yes, while 16.5% said no, and a whopping 28.2% said they weren’t sure. That last number surprised me and tells me we still have a long way to go with instrumenting our products and/or giving our product teams access to good data tools.
Understanding Employee Satisfaction: Are Your Product Teams Happy?
It’s not enough to hit financial metrics and customer adoption and growth numbers. I also wanted to see if people were satisfied with their team and company. So we asked participants, “How satisfied are you with how your team works together?” and “How satisfied are you with working at your company?” and asked people to rate both on a 7-point Likert scale with 7 being extremely satisfied and 1 being extremely dissatisfied.
Looking at the averages, it looks like people were more satisfied working at their company (an average of 4.9 out of 7) than with how their teams worked together (an average of 4.5 out of 7).
Averages can be misleading, so I also created a histogram of both sets of responses to see how they were distributed.
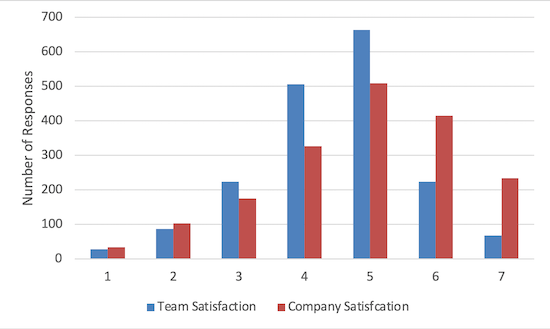
What strikes me about this graph is that most people rated their team satisfaction as a 4 or 5. The number of people who rated it a 1 or 7 are very low. However, with company satisfaction, we have many people who rated it a 6 or a 7, and on the very low end, people were more dissatisfied with their company than their team. Averages can be misleading.
My theory is we have more variation in the quality of companies than we do in the quality of team collaboration right now. And I suspect that’s because most of us are still learning how to work well with our teams. A 4 or 5 isn’t a bad score for team satisfaction, but I’d love to see this start to creep toward the 6s and 7s as we get better at cross-functional collaboration.
Discovery is a Team Sport: How Common Are Product Trios?
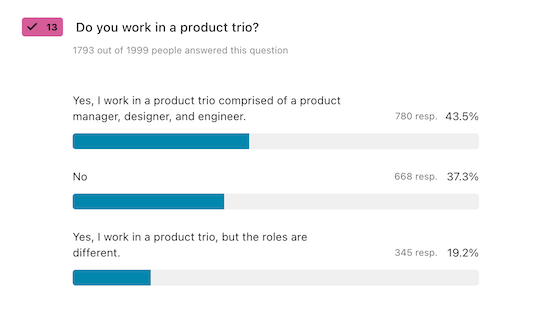
Speaking of team satisfaction, I also wanted to get a measure of how many people were working in cross-functional trios. So we asked, “Do you work in a product trio?”
The survey did explain that a product trio is typically comprised of a product manager, a designer, and a software engineer, but also indicated that these roles can be adapted to the roles available in their own organization. Here’s how folks responded:

I was thrilled to see that 62.7% indicated they worked in a product trio. Of those who said they worked in a product trio, 69.3% indicated their trios were comprised of the typical roles: a product manager, a designer, and a software engineer.
These numbers were higher than I thought they would be. I know many companies are still working to staff these roles and that changing team structure is hard. This was a bright spot that indicates we are indeed making progress.
However, it’s one thing to work in a product trio. It’s another thing entirely to work well with your trio. So we also asked, “How many hours did you spend last week collaborating with your product trio?”, “How long has your product trio been together?”, and “Consider the decisions that your product trio made last week. Do you feel like everyone had an equal say?”
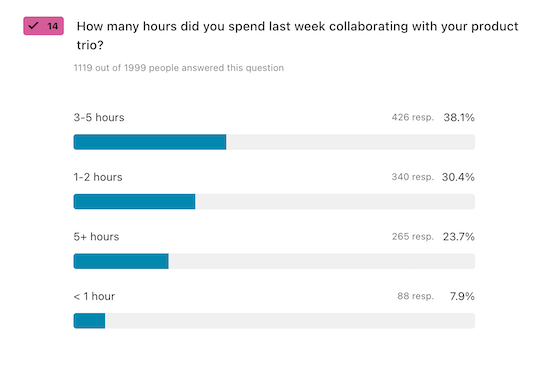
I was also pleasantly surprised to see that 23.7% of respondents were spending 5+ hours together and that another 38.1% of respondents were spending 3–5 hours with their product trio. These top two options are inline with what I would expect of a high-performing product trio. Again, this tells me we are making progress.
For the ~32% who were spending 2 hours or less with their product trios, I suspect they are still learning how to work as a team. Change is hard and it takes time. If you are working on one of these teams, don’t get discouraged. Just focus on making next week look better than last week.
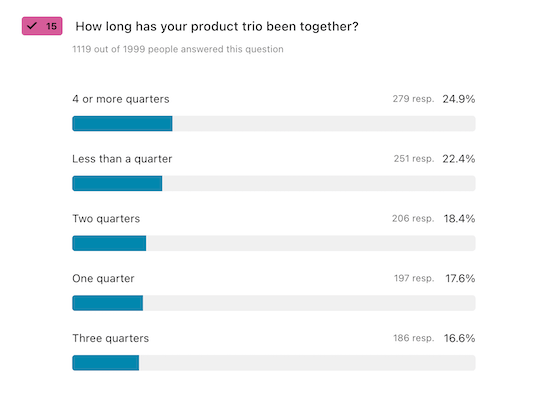
While it looked like many product trios were new—22.4% were together for less than a quarter and 17.6% were only together for one quarter—we had many teams who had been together for nearly a year or more. 16.6% were together for at least 3 quarters and another 24.9% were together for 4 or more quarters.
It takes time for a team to learn how to work well together. I suspect we’ll see a correlation between how long teams have worked together and how much time they spend together with how satisfied they are with working together. I’ll be sharing a more sophisticated analysis of how these different variables correlate (or don’t) in a future blog post.
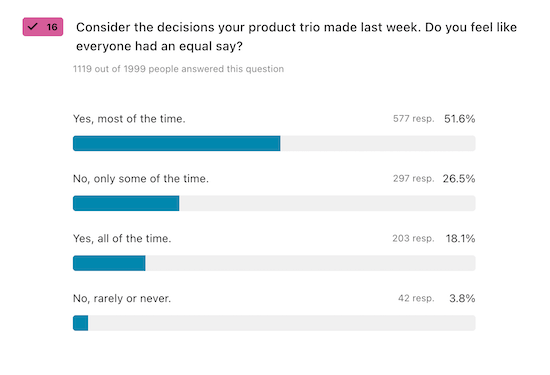
When we asked respondents if everyone on their trio had an equal say in their decisions, I was thrilled to see that a whopping 51.6% said “Yes, most of the time” and 18.1% said “Yes, all the time.” This is far better than I was expecting.
For those who said, “No, only some of the time” or “No, rarely or never”, we also asked, “Why wasn’t everyone able to have an equal say?”
The responses were fascinating. By far the most common responses were around learning how to collaborate—individuals dominated the conversation, teams didn’t know how to leverage or share their unique knowledge or domain experience, people had different beliefs around who owned what or who had the final say, trios didn’t have a process for when to meet or what to do, people didn’t feel comfortable speaking up, lack of trust, and so on. This is why in all of our Product Talk Academy courses we don’t just teach discovery skills, we teach teams how to effectively collaborate.
There were also many responses that indicated leaders are still dictating solutions, delivery still trumps discovery, too many companies are letting engineers or product managers alone dictate decisions, some designers still want to own discovery. There were many symptoms of old ways of working. It’s clear many companies are still in the messy stages of their transformations. I’m not surprised by this. While we have made tremendous progress, we still have much more to do.
There’s More: Diving into the Discovery Habits of 1,999 Product People
In an upcoming post, I’ll continue to break down the raw data. We asked people about how they set outcomes, how often they interview customers, what data visualization models they use, how they evaluate solutions, and which research tools they have access to.
When I designed the survey, I also enumerated several hypotheses about how different discovery habits contribute to team success. In an upcoming post, I’ll share those hypotheses and how the survey data can give a first glimpse of what might be true. In the meantime, I’ll be crunching the data.
If you don’t want to miss out on future posts about this survey, be sure to subscribe below.


Comments ()